September 17, 2018
Monitoring Your Chaos Engineering Experiments With Datadog

Monitoring and Chaos Engineering go hand in hand
Chaos Engineering, much like monitoring, is about continually removing uncertainty from the way your system behaves, especially under stress or failure. Controlling the cause of system failure (Chaos Engineering) while measuring its effect (Monitoring) allows your team to rapidly experiment and improve upon the systems they build.
Proactively and systematically creating failures for your systems allows you to not only tune for reliability, but also test whether your monitors/alerts/metrics are tuned properly. These are some simple questions you should be able to answer before you hear about issues from your customers:
- Are we missing any alarms for that new application we want to release?
- Are we sure the alarms are measuring the right signals?
- Are our alert thresholds too sensitive? Not sensitive enough?
- Are we taking timely action for all things mission critical?
- Are we paging the right team or on-call lead when alerts are triggered?
What are the benefits of this integration?
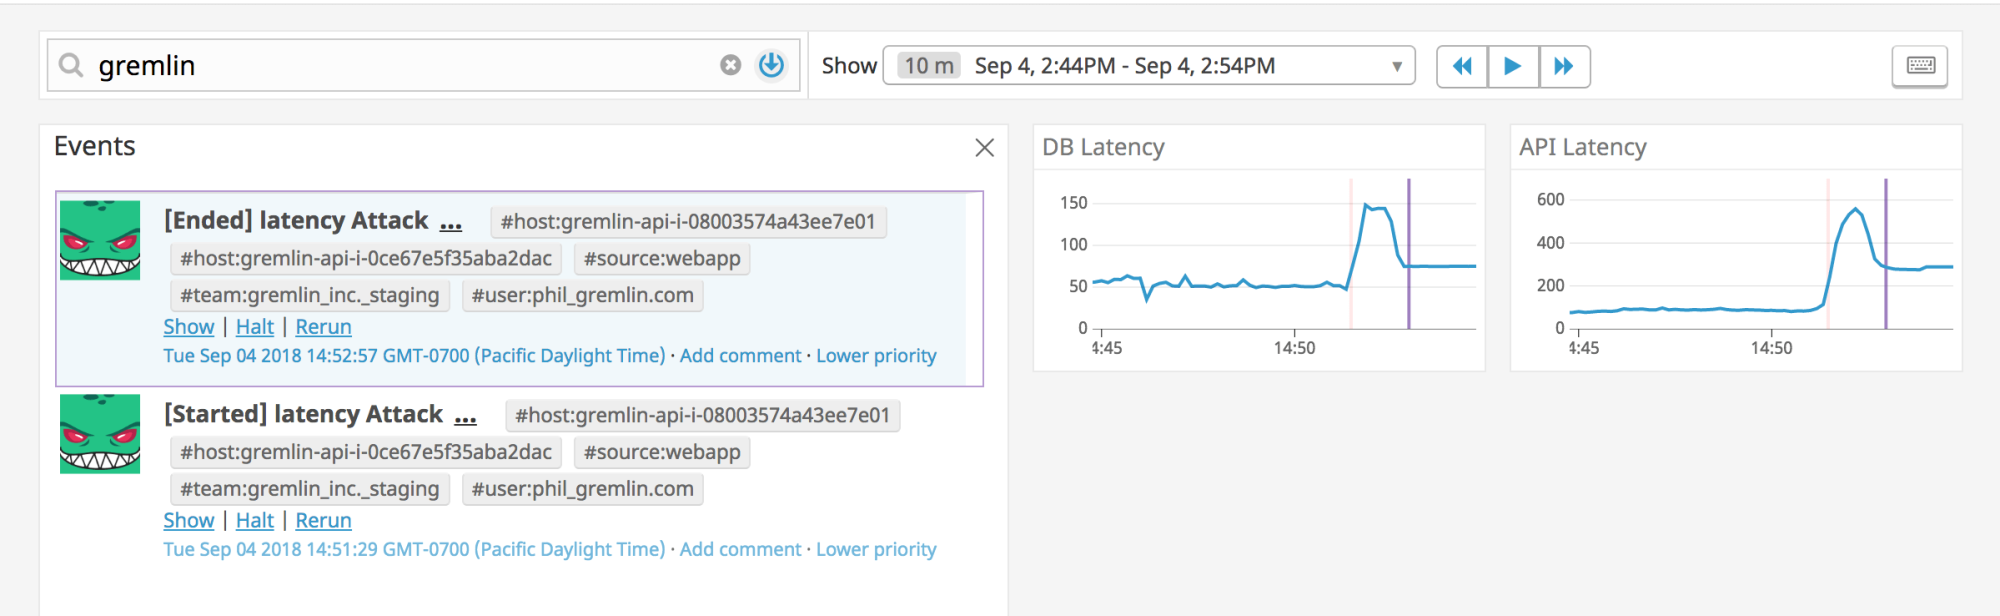
By using the new Gremlin integration with Datadog, you can visualize your Chaos Engineering experiments right alongside the metrics you’re interested in to really drive home the correlation between the cause and effect. You can also leverage Datadog Events -- which are status updates for your distributed system sent by internal teams, cloud providers, and third party services -- in order to add context to the continuous stream of information that Datadog collects about your system.
In the graph below, you can see the clear start of injected latency and easily distinguish between an experiment and a “real” issue.
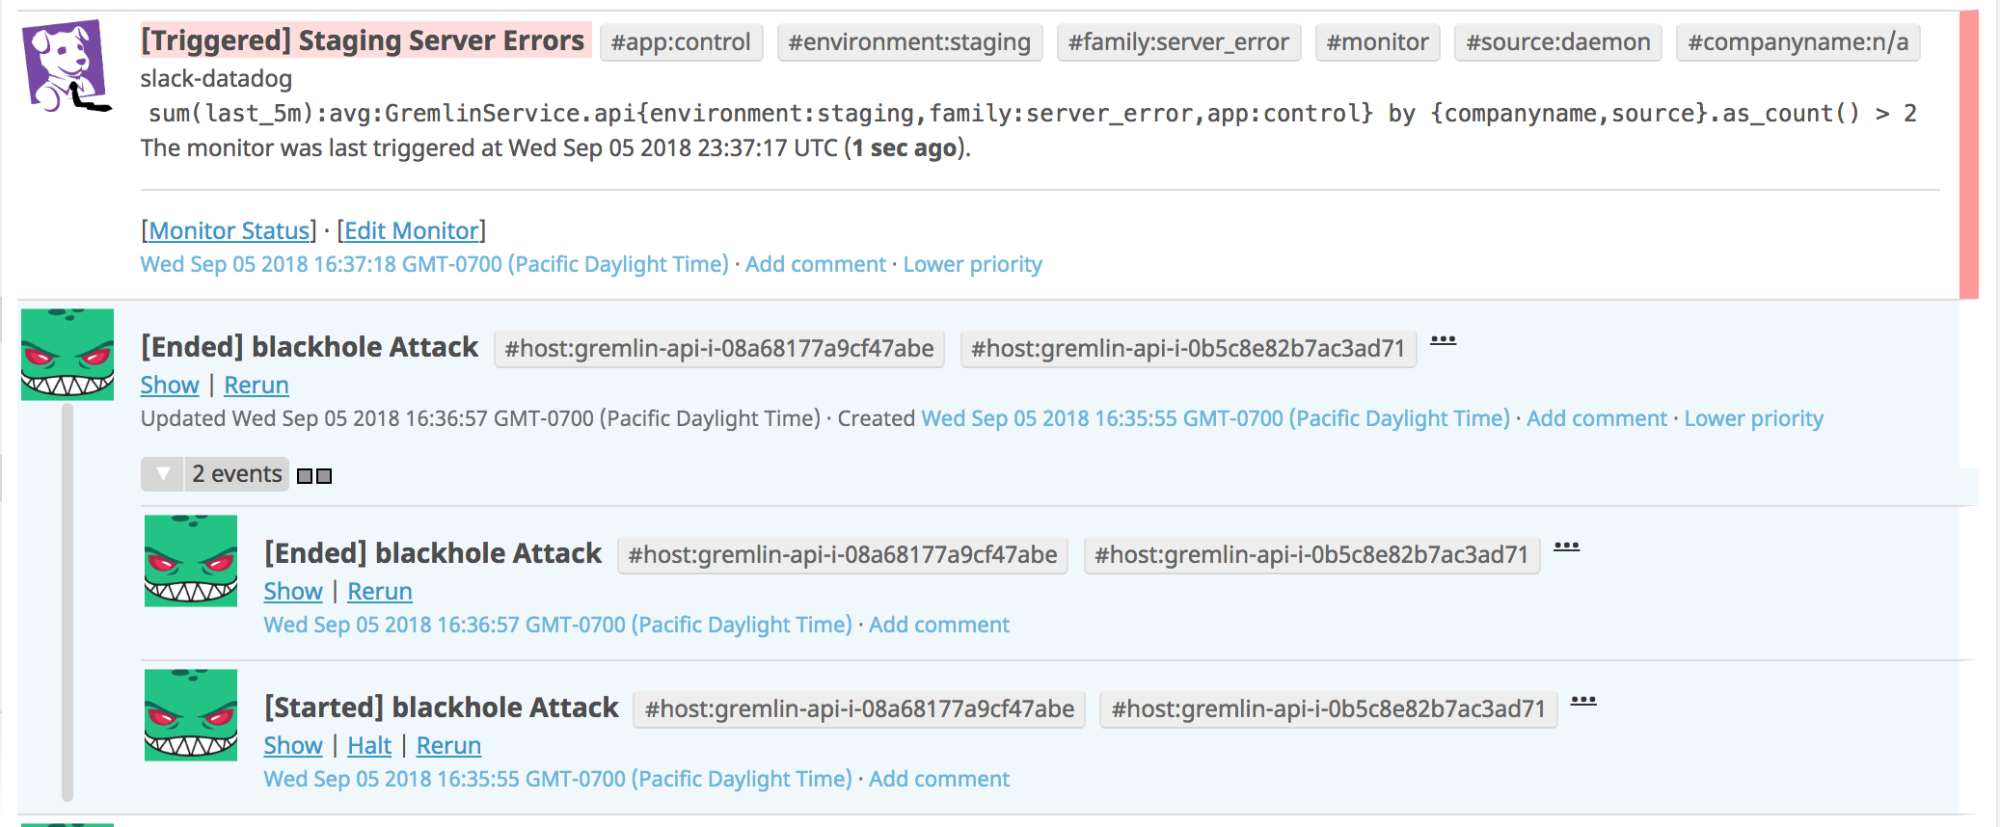
Gremlin integration also provides context about your chaos experiments to the Event Stream. When combined with other events, users can trace this stream to gather meaningful insights, such as how long an outage (induced by Gremlin) took to raise an alarm. All Gremlin events are tagged with various information about the attack, allowing for rich querying.
What’s in the future?
Roll back attacks from Datadog Monitors
We want to embolden users to be even more confident in running experiments by integrating directly into your monitors. You might already be using webhook mentions like PagerDuty to take immediate action when one or more of your Datadog alerts go off. Gremlin wants to allow you to provide ‘failure criteria’, which programmatically halts an attack should your critical system alerts start triggering.
Gremlin Agent Monitoring
We also want to allow Datadog users to track Gremlin-agent level metrics to use in your own dashboards. Machine-level metrics for Gremlin agents such as gremlin.attacks.active_count and gremlin.attacks.network.packets_dropped can offer more insight into exactly what Gremlin is doing at any given time on a machine. Exposing this information as Datadog metrics means you can graph and monitor this information alongside your existing metrics.
What do you think?
We worked on this integration due to high demand from some of our largest customers. Now that it’s generally available, we hope to collect feedback and make improvements. Check out this setup guide and if you have any thoughts or feature requests, please don’t hesitate to reach out to product@gremlin.com.